Measuring Customer Satisfaction
Many businesses have survey data somewhere, waiting for better analysis. Using a survey containing ratings from 1 to 10, this analytical view correlates ratings of overall satisfaction, firm expertise, and likelihood to recommend for several customer segments. Each circle represents a segment defined by the combination of industry, job function, gender, and product. Size corresponds to the number of customers in that segment.

Create and share on Tableau Public
Join the newsletter and find daily inspiration with the Viz of the Day. Yours could be featured next!
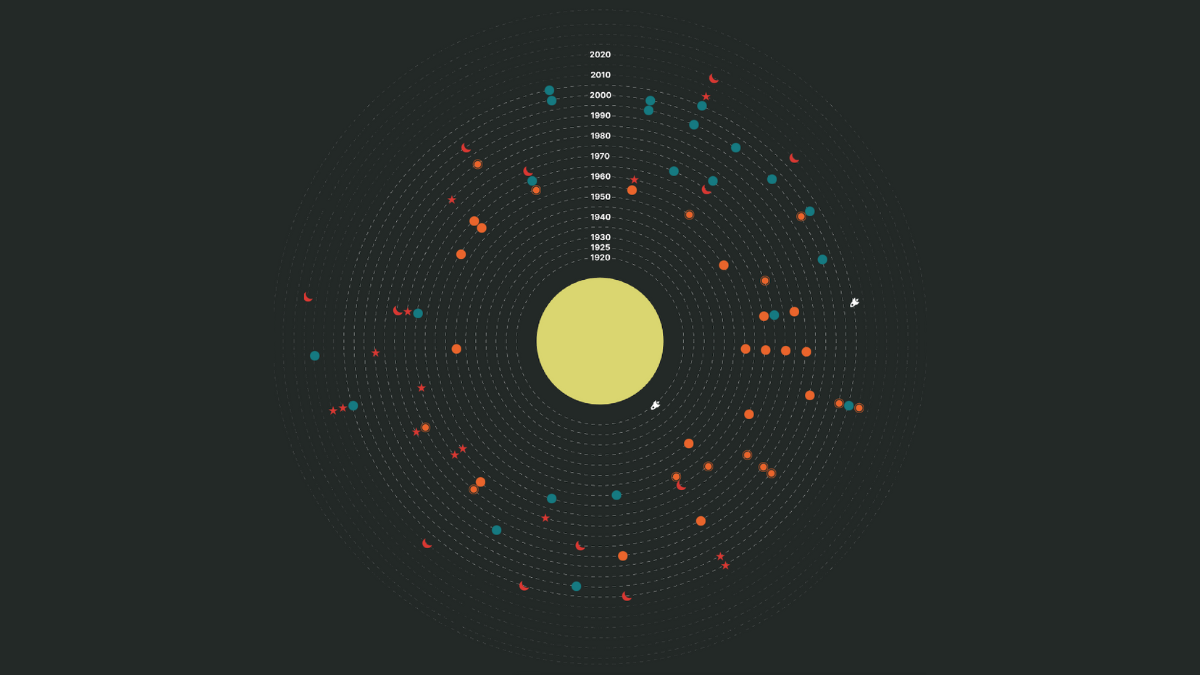
Stanislaw Lem (1921-2006)
Explore the rich legacy of Polish science fiction writer Stanislaw Lem with this #VizOfTheDay by Bartosz. This solar system inspired viz visualizes the books and works influenced by the author.
Interact with the viz