Tableau helps people see
and understand data
A mission that matters
We help people see and understand data. Seven words that drive everything we do. And they’ve never been more important.
In 2020, the world will generate 50 times as much data as in 2011 and 75 times the number of information sources (IDC, 2011). Within this data are huge opportunities for human advancement. But to turn opportunities into reality, people need the power of data at their fingertips. Tableau is building software to deliver exactly that.
Our products are transforming the way people use data to solve problems. We make analysing data fast and easy, beautiful and useful. It’s software for anyone and everyone.
We are Tableau Software.

Chris Stolte
Co-founder and Technical Advisor
The catalyst?
A US Department of Defense (DOD) project aimed at increasing people’s ability to analyse information. Brought to the Stanford University computer science department, the project took flight with Chris Stolte. Stolte, then a PhD candidate, was researching visualisation techniques for exploring and analysing relational databases and data cubes. His early career as a database programmer helped him see the problems with existing data analysis tools. Hungering for a project to change the world, he knew this was it.
Whenever I helped people get direct access to data, they were shocked and grateful. I’ve never forgotten that.

Pat Hanrahan
Tableau’s Chief Scientist and Co-founder
The mind behind Pixar
The mind behind Pixar, and Stolte’s PhD advisor, Professor Pat Hanrahan likewise realised it was a project that could change the world. A founding member of Pixar and chief architect for RenderMan, Pat had already transformed the world of animated film.
We create pictures that answer questions, but we do it for businesses that want to know things about their data.
Chris, Pat and a team of Stanford PhDs realized that computer graphics could deliver huge gains in people’s ability to understand data. The breakthrough arose when they brought together two computer science disciplines for the first time: computer graphics and databases. Their invention, VizQL™, let people analyse data just by building drag-&-drop pictures of what they wanted to see.

Christian Chabot
Co-founder and Chairman
“I see the future”
“I see the future” was Christian Chabot’s reaction when he saw what they invented. Chabot had spent years analysing data before studying entrepreneurship at Stanford Business School. Together, Christian, Chris and Pat formed a company and spun out of Stanford in 2003. With Christian on board as CEO, Tableau rapidly hit one success after another: first customers, multiple awards, international expansion, the first million in revenue, multiple new inventions. Tableau is revolutionising business analytics. And this is only the beginning.
We’ve become a democratising force in one of the world’s greatest areas of need.
Breakthrough after breakthrough
It’s not enough to be on a mission that matters. You must have the ideas and technologies to match. We do.
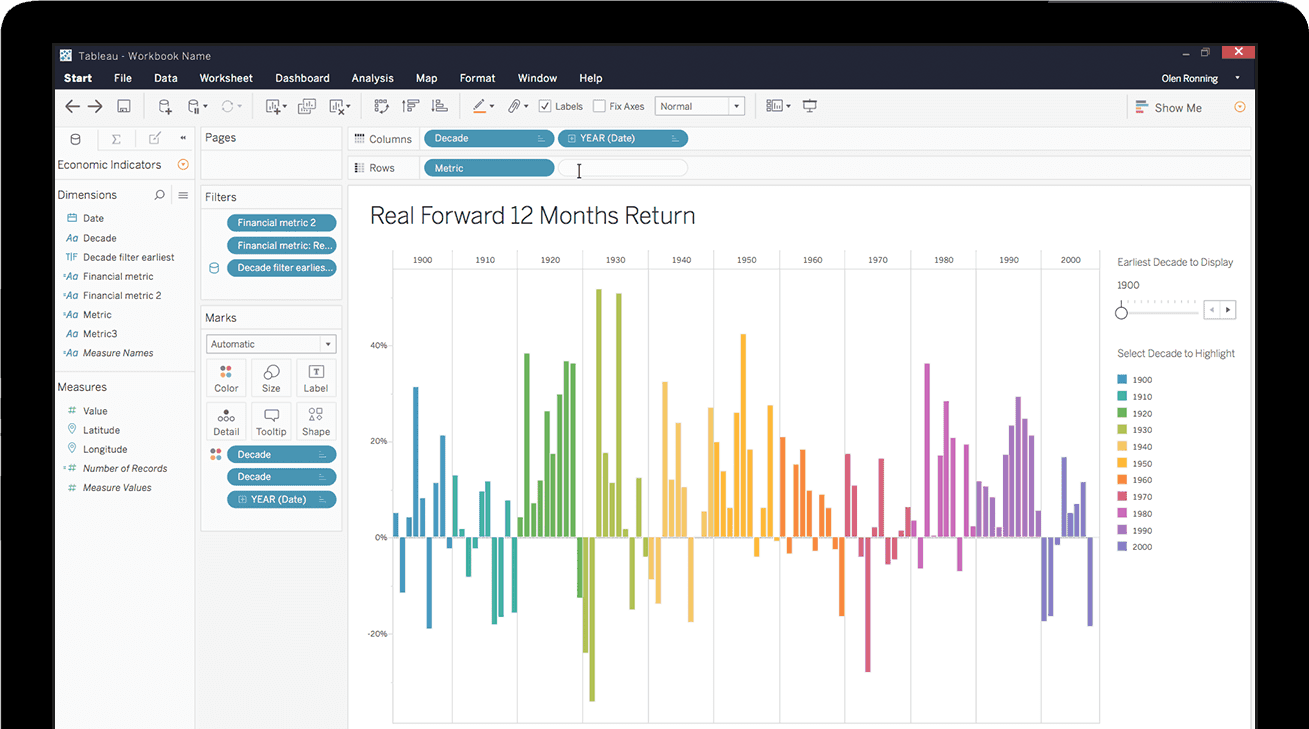
VizQL™
Natively visual, naturally faster
VizQL is a visual query language that translates drag-and-drop actions into data queries and then expresses that data visually. VizQL delivers dramatic improvements in people’s ability to see and understand data by abstracting the underlying complexities of query and analysis. The result is an intuitive user experience that lets people answer questions as fast as they can think of them. We believe that VizQL represents a foundational advancement in the area of data analysis and visualisation.
Don’t just take our word for it. Jim Gray, a Turing Award winner and a legendary figure in the field of databases, wrote about VizQL in a research highlight: “If you have ever been frustrated when trying to plot a useful graph from a simple spreadsheet, you would appreciate the value of a system that allows users to create stunning graphs interactively and easily from large multidimensional datasets.” High praise from one of the greatest minds of computer science.
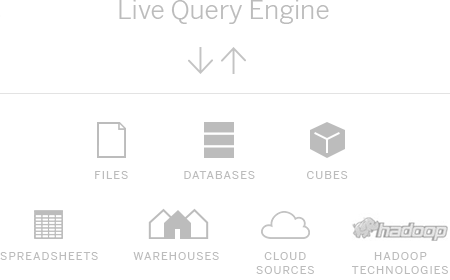
Live query engine
Data in your hands
Tableau’s live query engine is the first technology to let people natively query databases, cubes, warehouses, cloud sources, even Hadoop, without any programming or advance development. It lets people query diverse data sources with a point-and-click interface anyone can use.
People connect to data of any size with just a few clicks. Layer in additional data sources on the fly. Connecting to and combining data are easy enough for database novices to achieve.
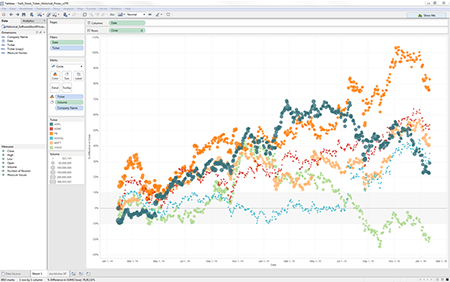
In-memory data engine
Blazing speed
When data sources are slow or just not right for the job, Tableau’s data engine is the answer. It’s a breakthrough in-memory analytics database designed to overcome the limitations of existing databases and data silos. Capable of being run on ordinary computers, it leverages the complete memory hierarchy from disk to L1 cache. It shifts the curve between big data and fast analysis. And it puts that power into the hands of everyone.
Liberate data
We believe data analysis should be about asking questions, not about learning software. We make inspiring, easy-to-use products that help people achieve greatness with data. So that data can reach its full potential and positively impact the world.
Data yearns to be free, to tell its stories to all those who care about its revelations. Discovering and sharing those stories should be easy. But it’s not. Why? Most software intended to help people access and understand data is hard to use. For too long, data has been trapped behind scripts, wizards and code.
Today, all that changes. Today, people can choose another way. Join us in the cause to liberate data for everyone.

Empower people
When a company gives people self-service analysis tools, they feel different. Respected. Capable. Powerful. People start to drive their organisation forwards in ways that could never have been anticipated. They express their full ingenuity and creativity.
Unfortunately, most business analytics products are built to centralise and control data, not democratise it. As a result, people at most companies are reliant on specialists just to answer basic questions. They stumble through Escher-like spreadsheets to work around inflexible business systems. Or they’re being stonewalled by enterprise-wide business intelligence platforms that spend more time in development than helping anyone.
There's no power in that approach. The power is in giving people the ability to think, act and deliver.
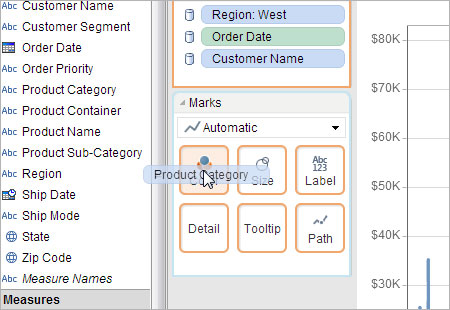
Tableau Desktop is an intuitive, drag-and-drop tool that lets you see every change as you make it. Watch the video.
Design for people
We design our products to focus on people. People working for big and small businesses, serving in government and building not-for-profit organisations. Bloggers. Students. Anyone. Everyone.
We architect our products from the ground up, to put the user first and everything else second. We are making a clean break from the past and taking a disruptive new approach to analytics. Product design is at the heart of everything we do.
The result so far? People in every industry love it. Because what you see is what you understand.
A different kind of company
We can’t change the world if we have the culture of a typical corporation. So we don’t.
We are on a mission
We believe that helping people to see and understand data is one of the most important missions of the 21st century. We proudly wear the mantle of “data geeks”.
We use our products
“We use our products” is a core company value. We’re not just listening to our customers’ needs. We’re living them. We’ll never stop listening to customers and we’ll never stop seeing the world from their point of view.
Data informs our decisions
We put data into action. Our R&D team analyse billions of log records from our products to improve them. Our HR team study our hiring trends to optimise facilities for growth and employee comfort. Our support team tracks customer cases to solve emerging issues early.
- Fusing computer graphics and databases
- Principles of visual understanding
- The cycle of visual analysis
Fusing computer graphics and databases
Our core technology VizQL is not only a breakthrough unification of computer graphics and databases. It’s also a case study in how to leverage best practices for human comprehension. Drag-and-drop actions become database queries that automatically display as beautiful visualisations.
This fundamentally new architecture does for data interactions in visual form what SQL did for data interactions in text form. VizQL statements describe an infinite class of sophisticated and useful visualisations. People have a single user interface to answer an infinite range of questions.
Read the seminal paper on VizQL, “Polaris: A System for Query, Analysis, and Visualization of Multidimensional Databases"
Download article
Principles of visual understanding
Perceptual and cognitive factors drive our product design. We painstakingly deliberate over every aspect of visual analytics.
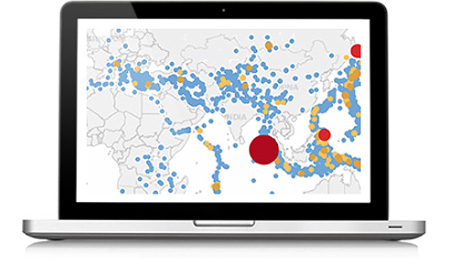
When we considered colour selection, we hired one of the world’s foremost colour-cognition experts to engineer Tableau’s colour palettes. To encode how shapes are represented, we studied people’s comprehension of shapes when they overlap. We custom-designed our maps because the usual online maps are meant for driving directions, not for data analysis.
Why all the effort? Because the right visual representation of data sparks just the right insights. A story unfolds as people navigate from one visual summary to another. Visual analytics creates the exploratory experience necessary for ordinary people to answer questions quickly.
Read about visual analytics in the paper from our development leaders Chris Stolte, Pat Hanrahan and Jock Mackinlay, “Visual Analysis for Everyone”
Download white paper
The cycle of visual analysis
We study how people ask a question, analyse data to get an answer, then ask their next question. We call this the “cycle of visual analysis”: an iterative, non-linear process where people ask questions, forage for data, create pictures and discover new questions to ask.
The process is rarely sequential. A specific view of data typically generates more questions. It might suggest the need for more data. An insight might suggest a new task. The act of communicating a finding may require a new visualisation.
We design our products to support the cycle of visual analysis. And to guide people through it. Our patented Show Me™ technology recommends the best way to visualise data. Based on heuristic models from years of proven research, Tableau defines the right kind of visualisation based on the data types and the problem at hand.
We know that thinking with data is hard. Our goal is to help people answer questions as fast as they can think of them.
Learn about Tableau’s patented “Show Me” technology from Jock Mackinlay’s technical paper.
Download white paper
Helping people answer
their questions
We believe in the triumph of facts. A collection of data is a collection of facts, and facts are the foundation of human progress. Hear first-hand how our customers are using Tableau to harness the power of data.
Fostering collaborative colleagues and happier workers
Better workplaces mean happier employees empowered to express their fullest ingenuity and creativity.
Our goal is to liberate the natural curiosity and creative energy stored in people everywhere – energy which is too often suppressed because it hasn't had a proper channel for activity.
HotelQuickly
Sharing data stories from the C-suite to the business decision maker at a travel startup
Using data to make a difference in the world
Every day there are millions of opportunities to improve people’s lives by making better use of data. Disease research, education patterns, industrial efficiency, patient care, government spending – the opportunities are endless.
United Way of the Bay Area
Reducing poverty while conserving non-profit resources with Tableau Online